Noise & false-positive elimination
Alert-driven and duplicate tickets that can be tuned out at the monitoring or application configuration layer, so the work never reaches a queue.

terra-diagnose analyzes your support tickets, software licences, service utilization and cloud FinOps baselines to uncover cost-takeout, efficiency and automation opportunities.
terra-diagnose is a holistic IT Opex, FinOps and operations diagnostic engine. It uncovers cost-takeout, efficiency and automation opportunities across your IT landscape by analyzing four kinds of evidence from your own data.
Volumes, repeat patterns, noise and automation candidates across your ticket history.
Usage patterns across software subscriptions and licences, set against what you pay.
How services and capacity are actually used, to surface unused and under-used capacity.
Spend and usage baselines that anchor cost-takeout and governance.
Traditional managed-services contracts often reward ticket volume. Analyzing your own data shows which of these levers pays off for you.
Alert-driven and duplicate tickets that can be tuned out at the monitoring or application configuration layer, so the work never reaches a queue.
High-frequency service requests such as access, data fixes, batch restarts and environment checks, ready for straight-through automation.
Complex L1.5/L2 diagnostic work where AI agents gather telemetry, correlate recent changes and propose verified resolutions for engineer sign-off.
Compare what you pay for with what is actually used across subscriptions and licences, and act on the gap.
Find under-used services and capacity across your landscape, and the support-team performance patterns behind your run-cost.
A clear baseline of cloud spend and usage to steer commitments, right-sizing and ongoing cost governance.
terra-diagnose analyzes the artifacts you already have, and our IT experts turn the findings into a plan you can execute.
Support tickets and logs, software subscriptions, hosting and cloud usage, and service utilization.
terra-diagnose and our IT experts find cost-takeout, efficiency and automation opportunities.
A structured 30-60-90 day Optimization Plan with quick wins and measurable savings.
Execute with automation, Agentic AI and lean application operations, with people kept in control.
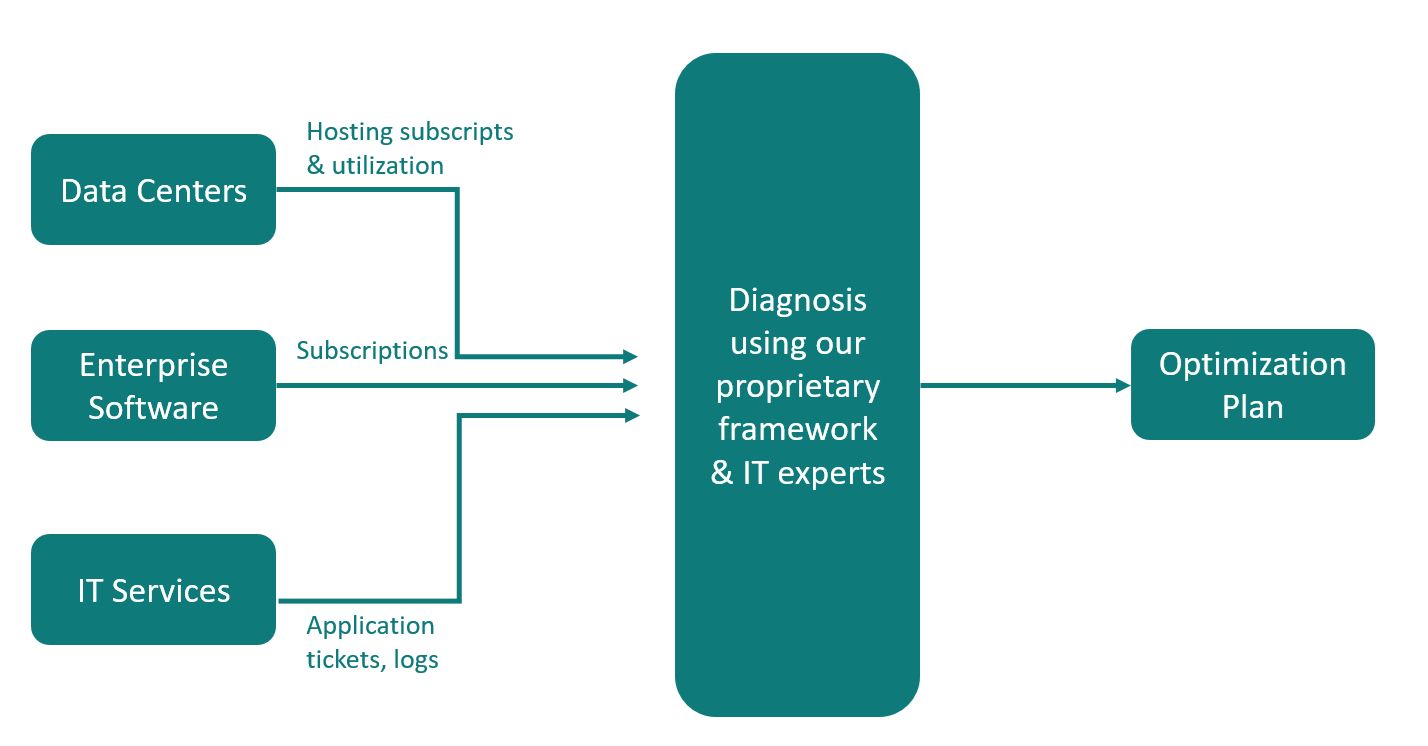
An in-depth evaluation of the IT ecosystem, including unused capacity, software subscriptions and support team performance, that highlights operational gaps and optimization opportunities.
A structured 30-60-90 day execution plan that captures the identified opportunities, with quick wins, measurable cost savings and a smaller footprint.
The diagnostic connects directly to the practices that remove cost from the landscape.
Deploy autonomous AI agents and deterministic automations that complete multi-step business and IT tasks with people kept firmly in control.
Learn moreMove from headcount-heavy ticket keeping to lean, engineering-led application operations that systematically shrink incident volume.
Learn moreIndependent verification and automated testing that prove your enterprise software works reliably before every release.
Learn moreWhat IT, finance and procurement leaders ask before a diagnostic.
We start from the artifacts you already have, such as support ticket exports, software subscription and licence inventories, utilization reports and cloud billing data. We confirm the exact list when we scope the diagnostic.
The focus is the structural run-cost of your IT landscape: removing avoidable demand such as noisy and repeat tickets, automating routine work, and right-sizing what you pay for. The diagnostic shows where each lever applies before any decision is made.
A benchmark compares you with averages. Our diagnostic works from your own operational data, including tickets, usage and utilization, so the opportunities it finds are specific to your landscape.
A Diagnosis Report that evaluates your IT ecosystem and highlights operational gaps and opportunities, and an Optimization Plan: a structured 30-60-90 day execution plan with quick wins and measurable savings.
Tell us where IT run-cost is growing and what data you have today. We will arrange a demo and suggest the right starting point.